Data required for quality control
Raw data observed at meteorological stations may contain error data by instrument failure or during the process of recording or digging up the data. Error data or data that requires attention is as follows.
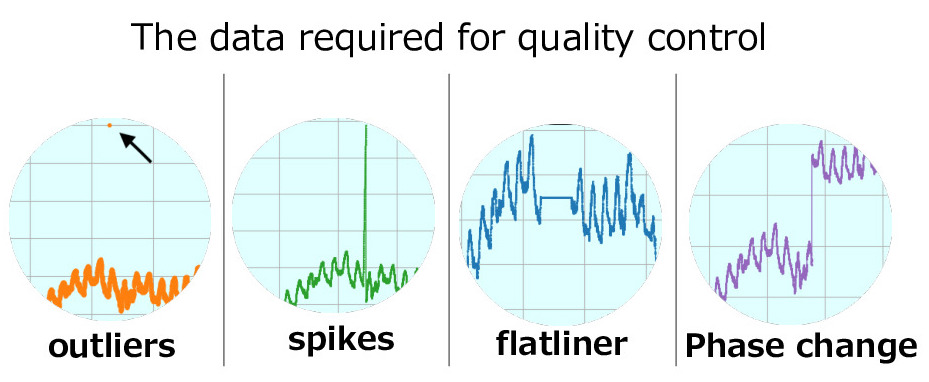
The most frequently occuring data are outliers. This includes missing data and data that was output with misligned digit when digging up the data from tape.
Remove outliers
[Step 1] An easy way to remove outliers is to set up a data range and replace them with the missing values. For example, we set the temperature range from -30 C to +30 oC for beavers and -40 C to +45 oC for other stations.
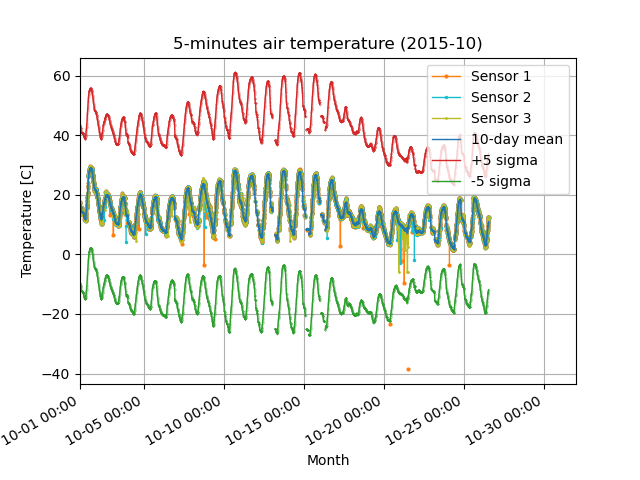
This method, however, does not remove outliers in the range. Therefore, another (or additional) way to remove outliers is to identify the data from the 5 sigma standard deviation of the mean.
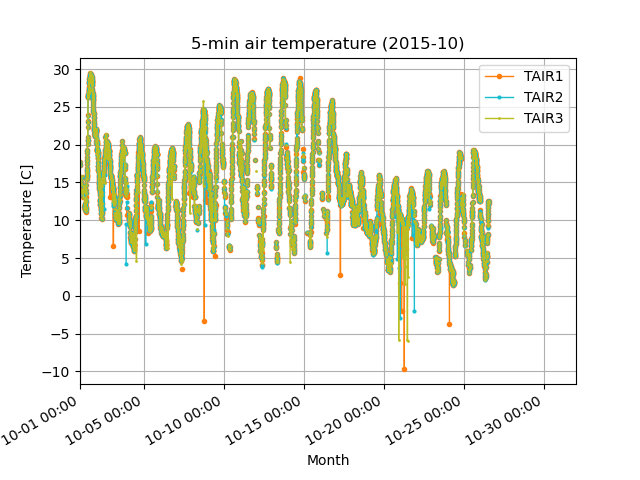
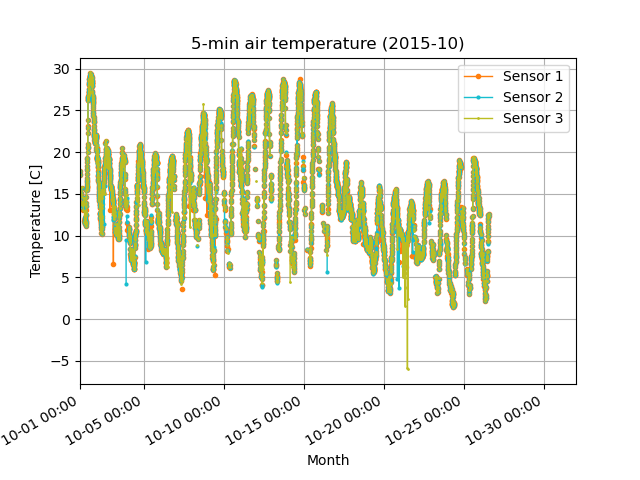
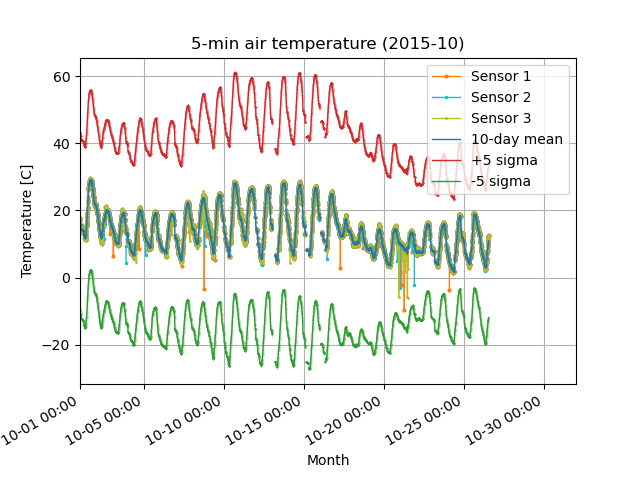
[Step 2] Calculate the 3-hour mean and 10-day standard deviation, and remove data that exceeds the +/- 5 sigma standard deviation from the mean.
Before (left) and after (right) quality control in Step 2. Removed the orange outliers that deviated from the -5 sigma standard deviation (green line).
Sample program
This program calculates the mean and standard deviation and replace outliers out of the criteria (+/- 5 sigma standard deviation from mean) with the missing value.
    ttmax['runmean'] = ttmax.rolling(window=nwindow_run, min_periods=1, center=True,axis=0).mean().mean(axis=1)
    ttmax['std'] = ttmax.rolling(window=nwindow_std, min_periods=1, center=True, axis=0).std().mean(axis=1)
    ttmax[namep] = ttmax['runmean']+stdref*ttmax['std']
    ttmax[namem] = ttmax['runmean']-stdref*ttmax['std']

    for i in range(0,len(nvar)):
        # judge data > mean + 5_sigma or data < mean - 5_sigma
        iierr = ttmax[(ttmax[nvar[i]]>ttmax[namep]) | (ttmax[nvar[i]]<ttmax[namem])]

        if not iierr.empty:
           print('Data required for QC at '+locname+'!' )
           ttmax[nvar[i]].loc[iierr.index] = np.NaN

        del iierr
Source file: DQC_std.sampleprogram.py
Remove spikes
[Step 3] The spike data are due to abrupt changes in the data over a short time, which can be identified by the large temporal trends of the data. We remove the spikes where only one sensor is recorded and the other two show missing values. Here, the criteria for temporal tendency is above 8 oC in 5 minutes.
    for ival in range(0,len(nvar)):
        var = nvar[ival]
        newvar = var+'_diff'
        ttmax[newvar] = ttmax[var].diff()**2

    iierr = ttmax[(ttmax['TAIR1_diff']>icrt_dt) | (ttmax['TAIR2_diff']>icrt_dt) | (ttmax['TAIR3_diff']>icrt_dt) ]
    if not iierr.empty:
       print('Data required for QC at '+locname+'!' )
       for iert in range(0,len(iierr)):
           ierr=ttmax.index.get_loc(ttmax[(ttmax['TAIR1_diff']>icrt_dt) | (ttmax['TAIR2_diff']>icrt_dt) | (ttmax['TAIR3_diff']>icrt_dt) ].index[iert])

           if (ttmax.loc[ttmax.index[ierr-1] ,['TAIR1','TAIR2','TAIR3']].isna().sum() == 2):
              ttmax.loc[ttmax.index[ierr-1] ,['TAIR1','TAIR2','TAIR3']] = np.NaN

           if (ttmax.loc[ttmax.index[ierr] ,['TAIR1','TAIR2','TAIR3']].isna().sum() == 2):
              ttmax.loc[ttmax.index[ierr] ,['TAIR1','TAIR2','TAIR3']] = np.NaN
Source file: DQC_dTdt.sampleprogram.py
[Step 4] An additional method to eliminate spikes is to determine if nine data (three sensors and previous, current, and next time step) exceed the treshold.
       for ival in range(0,len(nvar)):
            var = nvar[ival]
            newvar = var+'_diff'
            ttmax[newvar] = ttmax[var].diff()**2

       icrt_dt = 64
       iierr = ttmax[(ttmax['TAIR1_diff']>icrt_dt) | (ttmax['TAIR2_diff']>icrt_dt) | (ttmax['TAIR3_diff']>icrt_dt) ]
       if not iierr.empty:
           print('Data required for QC at '+locname+'!' )

           icrt_std = 64
           for iert in range(0,len(iierr)):
               ierr=ttmax.index.get_loc(ttmax[(ttmax['TAIR1_diff']>icrt_dt) | (ttmax['TAIR2_diff']>icrt_dt) | (ttmax['TAIR3_diff']>icrt_dt) ].index[iert])

               # pick up 9 data (three sensors and previous, current, next time steps)
               tmp = ttmax.loc[ttmax.index[ierr-1] ,['TAIR1','TAIR2','TAIR3']]
               tmp = pd.concat([tmp,ttmax.loc[ttmax.index[ierr] ,['TAIR1','TAIR2','TAIR3']]],axis=0)
               tmp = pd.concat([tmp,ttmax.loc[ttmax.index[ierr+1] ,['TAIR1','TAIR2','TAIR3']]],axis=0)
               ttmax_med = tmp.median()
               del tmp

               # Determine if the data is above the threshold
               for it in range(0,2):
                   inum = ierr-1+it

                   # When the data of three sensors exceeds the difference of 1 sigma
                   if ttmax.loc[ttmax.index[inum] ,['TAIR1','TAIR2','TAIR3']].std()>1.:

                      # When the data of one sensor differs from the median of 9 data by 8 oC or more
                      dd = (ttmax.loc[ttmax.index[inum] ,['TAIR1']].values-ttmax_med)**2
                      if (dd > icrt_std):
                         ttmax.loc[ttmax.index[inum] ,['TAIR1']] = np.NaN
                      del dd

                      dd = (ttmax.loc[ttmax.index[inum] ,['TAIR2']].values-ttmax_med)**2
                      if (dd > icrt_std):
                         ttmax.loc[ttmax.index[inum] ,['TAIR2']] = np.NaN
                      del dd

                      dd = (ttmax.loc[ttmax.index[inum] ,['TAIR3']].values-ttmax_med)**2
                      if (dd > icrt_std):
                         ttmax.loc[ttmax.index[inum] ,['TAIR3']] = np.NaN
Source file: DQC_9variances.sampleprogram.py
Before (left) and after (right) quality control in Step 4: Removed major noisy data