Reading time-series station data
This page provides how to read hourly time-series station data and create timestamps from the days of the year using Python.
The sample Python program for reading the hourly data is as follows.
Setup the modules
Importing the Python module to access the script from another Python file or module.
import csv
import glob
import pandas as pd
import xarray as xr
import numpy as np
import matplotlib.pyplot as plt
import matplotlib.dates as mdates
import calendar
import shutil
import os
import sys
from datetime import datetime, date
Read the CSV data
The first step is to read the CSV data.
       #print(' ----- Read CSV file ------')
       df = pd.read_csv(findir+filename+'.csv' \
          , delimiter = ',', skiprows=[0,2,3], na_values = ['NAN','"NAN"'],header=0)
‘findir’ is the directory name where the data are stored, and ‘filename’ is the file name.
The data contains four header rows. Therefore, skip three rows and use one header row as headers (column names).
The original dataset contains several types of missing values, such as NAN, “NAN”, and “””NAN”””. Add two kinds of NAN and “NAN” to the missing values information in the read module. (Python seems to recognize “NAN” and “””NAN””” as the same format).
Generate timestamps (YY-MM-DD HH:MM:SS)
Next, generating timestamps using the days of the year and hour information.
       # --- create timestamp
       # convert 'the days of the year' and time to the date/time (YYYY-MM-DD HH:MM:SS)

       timestamp = dayofY_toTimeStamp(df)
def dayofY_toTimeStamp(df):

    newdate = pd.to_datetime(df.loc[:,'Year'].values*10000000+df.loc[:,'Day_of_Year'].values*10000+df.loc[:,'HrMin'], format='%Y%j%H%M')

    return newdate
dayofY_toTimeStamp is the subroutine to pick up the date and time (YY-MM-DD HH:MM:SS).
Create new data frame
Create a new empty data frame with the timestamp index, add some data columns from the original data, and concatenate other datasets along wth the columns.
       # --- create a new dataframe
       df2 = pd.DataFrame(index=timestamp)
       df2.index.names = [tlabel]

       df2['RECORD']=df.loc[:,'RECORD'].values
       df2['SiteNum']=stid.values

       # Extract data from header name "Year" to "XMTPWR"
       tmp = df.loc[:,'Year':'XMTPWR']
       tmp[tlabel] = timestamp
       tmp.set_index(tlabel, inplace=True)

       # Concatenating two datasets along with the column (axis=1)
       df2 = pd.concat([df2,tmp],axis=1)
Save the data
Save the data to a CSV file with adding required header information.
    #----
    # save the data
    #----

    print('save')
    print(newdf)
    save_csv_file(newdf,outdir,iyr,locname,head)
def save_csv_file(dat,outdir,iyr,filename,head):

    tmpdir = 'tmp/'
    filelist = glob.glob(os.path.join(tmpdir, "*"))
    for f in filelist:
        os.remove(f)

    dat.to_csv(tmpdir+filename+'.csv',index=True, na_rep='NAN')

    # add header information to the datasets
    fla = tmpdir+os.path.splitext(filename)[0]
    addheaders(fla,fla+'.2','.csv',head[0],0)
    addheaders(fla+'.2',fla+'.3','.csv',head[2],2)

    # save the dataset in the 'outdir' directory
    newfile = outdir+iyr+'/'+filename
    filen = newfile + '.csv'
    os.system('rm '+filen)

    addheaders(fla+'.3',newfile,'.csv',head[3],3)
    print(newfile+'.csv')

def addheaders(filename1,filename2,ext,head,inum):

   with open(filename1+ext, "r") as infile:
     reader = list(csv.reader(infile))
     reader.insert(inum, head)

   with open(filename2+ext, "w") as outfile:
     writer = csv.writer(outfile)
     for line in reader:
         writer.writerow(line)
‘newfile’ is the final data.
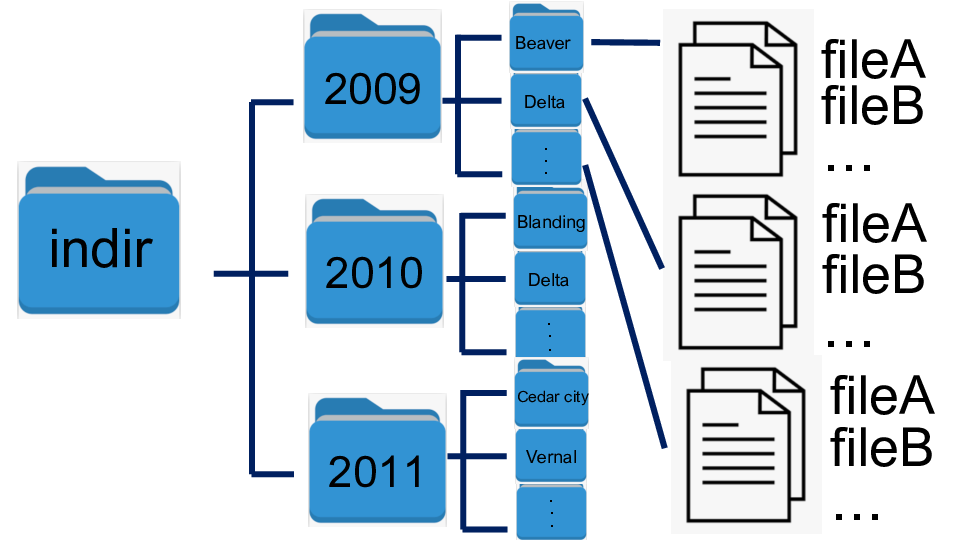
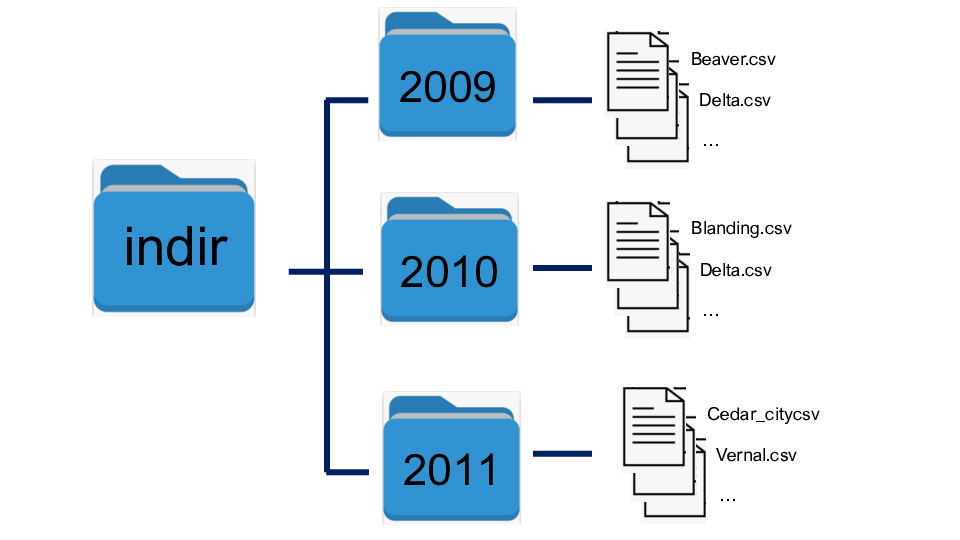
Organize file and directory structure
This program raads all files under multiple directories, merges multiple files into one file per station each year, and saves the files.
Initial directory structure:
Output directory structure:
Source file: read_merge_files.py