Daily data analysis
Reshape
To analyze the climate data, we sometimes want to reshape the dimensions of an array. Usually, climate data have only one dimension for the time coordinate. However, we can apply a simple analysis method by making two dimensions for the time coordinate: year and day. Once we define the Xarray DataArray or DataSet, it is more challenging to reshape the coordinate. In this example, we first reshape the data array based on NumPy and then define the Xarray to make a plot.
Download Sample Files
Packages
This script uses the basic packages. The datetime package helps us to make the time coordinate easily.
1import numpy as np
2import pandas as pd
3import xarray as xr
4import os
5import matplotlib.pyplot as plt
6import matplotlib.dates as mdates
7from datetime import datetime
Read CSV file
This script gets climate data from the CSV file. Please check here for more details.
10# ----- Parameter setting ------
11# == Date ==
12dateparse = lambda x: datetime.strptime(x, '%Y-%m-%d')
13#dateparse = lambda x: datetime.strptime(x, '%Y-%m-%d %H:%M:%S')
14#dateparse = lambda x: datetime.strptime(x, '%m/%d/%y %H:%M')
15
16# == CSV file name and location"
17fcsv = 'GHCN_sample.csv'
18
19# == Your definition of variable names
20## Day,Precipitation, Multi-Day Precipitation, Snow Depth, Snow Fall, Min Temperature, Max Temperature, Ref Evapotranspiration,
21vnames = ['date','precip','mdpr','sdep','sfall','tmin','tmax','refe']
22
23# == location of header. It starts from 0
24nhead = 13
25
26# == Figure name ==
27fnFIG = os.path.splitext(os.path.basename(__file__))[0]
28
29# ------------------------------
30
31print(' ----- Read CSV file ------')
32# additional parameters: encoding = 'ISO-8859-1'
33fin = pd.read_csv(fcsv,
34	 delimiter = ',', header = nhead,  na_values = ['M','T','S'],
35         names = vnames, parse_dates = ['date'], date_parser = dateparse)
36print(fin)
37print(' ----------------------------')
38
Reshaping
This part is the main description for formating the data array. First, we define two coordinates for the time dimension: year and day. The array “date” comes from the CSV file (Line 40). The next line defines “yyyy”, which corresponds to the NumPy array from the first to the last years in the “date” array with a 1-year interval. The NumPy array “days” indicates a day of the year from 1 to 365 days. We ignore all leap days (i.e., Feb 29) here. We also define the NumPy array “mmdd” for mm-dd format (i.e., 05-01) to make the readable time axis. The important point here is that all coordinates are NumPy arrays.
39# ---- Make coordinates ----
40date = fin.date
41yyyy = np.arange(date[0].year, date[date.size-1].year+1,dtype='int')
42days = np.arange(1,366,dtype='int')
43mmdd = pd.date_range(start='2001-01-01', periods=365, freq='D').strftime('%m-%d').to_numpy(dtype='str')
44#print(yyyy)
45#print(days)
46#print(mmdd)
47
48def reshape_data(date,series,yyyy,days,mmdd):
49  ndat = np.empty((yyyy.size,days.size))
50  ndat[:] = np.NaN
51  for it in range(0, date.size):
52    #print(' it = ',it,' date = ',date[it], ' values = ',series.iloc[it])
53    iy, = np.where(yyyy == date[it].year)
54    id, = np.where(days == date[it].day_of_year)
55    if date[it].is_leap_year and date[it].day_of_year > 60:
56       #print('  adjusting day-1 because of a leap year')
57       id = id - 1
58    ndat[iy,id] = series.iloc[it]
59
60  odat = xr.DataArray(ndat, dims=('year','day'), coords={'year': yyyy, 'day': days, 'mmdd': ('day', mmdd)})
61  odat.set_index(days="mmdd")
62  return(odat)
63
64
65tmax=reshape_data(date,fin.tmax,yyyy,days,mmdd)
66tmin=reshape_data(date,fin.tmin,yyyy,days,mmdd)
67
68print(tmax)
69print(tmin)
70
Data analysis
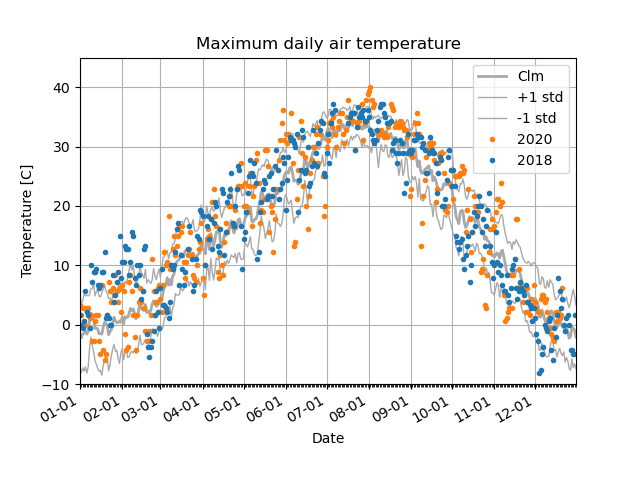
71#--- calculate climatology and standard deviations for daily basis
72tmax_clm=tmax.mean(dim='year', skipna=True)
73tmax_sd=tmax.std(dim='year', skipna=True)
Plot a figure
 75# ------- Draw Figure -------
 76fig, ax = plt.subplots()
 77ax.plot(mmdd,tmax_clm, '-', color='darkgray', linewidth=2)
 78ax.plot(mmdd,tmax_clm+tmax_sd, '-', color='darkgray', linewidth=1)
 79ax.plot(mmdd,tmax_clm-tmax_sd, '-', color='darkgray', linewidth=1)
 80ax.plot(mmdd,tmax.sel(year=2020), 'o', markersize = 3, color='C1')
 81ax.plot(mmdd,tmax.sel(year=2018), 'o', markersize = 3, color='C0')
 82#ax.plot(mmdd,tmin.sel(year=2020), 'o', markersize = 1)
 83#ax.plot(mmdd,tmin.sel(year=2018), 'o', markersize = 1)
 84
 85
 86ax.set_xlabel('Date')
 87ax.set_ylabel('Temperature [C]')
 88ax.set_title('Maximum daily air temperature')
 89
 90# --- Uncomment out for the format of the ticks --
 91ax.xaxis.set_major_locator(mdates.MonthLocator())
 92ax.xaxis.set_major_formatter(mdates.DateFormatter('%m-%d'))
 93ax.xaxis.set_minor_locator(mdates.DayLocator())
 94# ------------------------
 95
 96ax.legend(['Clm','+1 std','-1 std', '2020', '2018'])
 97#ax.legend(['Tmax (clm)','Tmax (2020)','Tmin (2020)','Tmax (2018)', 'Tmin (2018)'])
 98#ax.axis(xmin='05-01', xmax='08-01')
 99ax.axis(xmin='01-01', xmax='12-31')
100ax.axis(ymin=-10, ymax=45)
101ax.grid(True)
102fig.autofmt_xdate()
103
104
105plt.draw()
106plt.savefig(fnFIG+".png")