Looking into the zoom feature
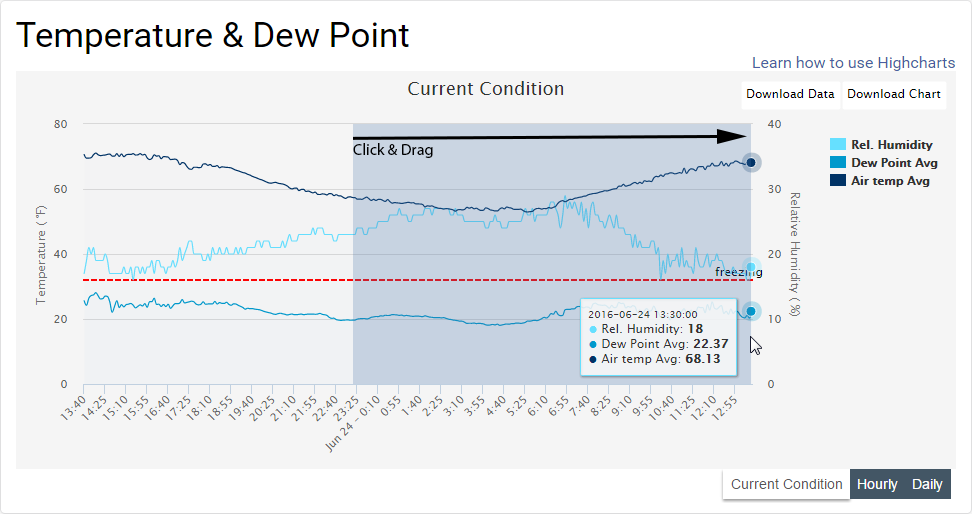
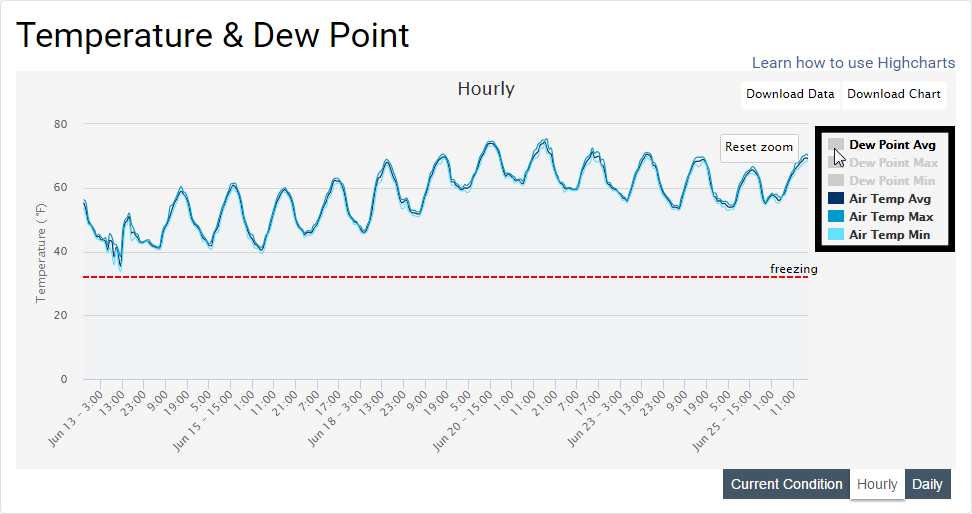
Click and drag anywhere inside the chart to start using the zoom feature. Once you are zoomed in, hold shift then click and drag again to pan around while zoomed in. Using both of these features can help you view the data you want to see.
To reset the zoom level back to its original state click on the "reset zoom" button. This button is located to the top right corner of the graph and only appears once you have already zoomed in.
Hiding variables
Located to the right of the chart is the legend. Clicking on one the legend items gives you the option to hide/show your current selection.
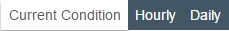
Changing intervals
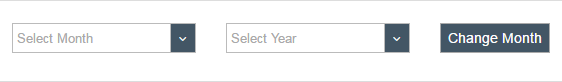
Viewing previous data
To view historical data from the selected station, choose a date range then click change Month. Make sure to check that the data you are trying to view is within the period of record. You can find the period of record right under the name of the station at the top of the page.
Downloading data
If you would rather have raw data or a picture of the chart you're viewing we supply an easy way of going about that.
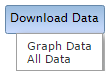
Under Download Data there are two options. Graph Data will download all data that corresponds with the current chart you are viewing. Please note that if you switch tabs you will be able to download a different set of data.
All Data will download all data related to the current tab you are on.
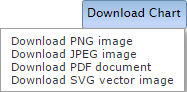
Under Download Chart there are four options. You may download a picture of any chart as a PNG, JPEG, PDF, or SVG. Please note that if you are zoomed in or have certain variables unselected while downloading a picture. Those modifications will be applyed to the image you download.