Analysis of daily maximum temperature
This page provides how to calculate daily maximum temperature and plot using Python.
Calculated daily maximum/minimum data
The first step is to read the CSV data.
       #print(' ----- Read CSV file ------')
       df = pd.read_csv(indir+filename \
          , delimiter = ',', na_values = ['NAN','"NAN"'],header=None)
       print(' ----------------------------')
The ‘indir’ is the data’s directory, and the ‘filename’ is the file name. We decline the missing value as ‘NAN’ in the read module.
Compute the daily maximum
The daily maximum can be calculated from hourly or 5-minutes data using the resample.max() function.
        if "TAIR" in var:
            newdat1[var] = np.where((np.abs(newdat1[var]) <= 60),newdat1[var],np.NaN)
            ttmax = pd.DataFrame(newdat1,columns=[var,tlabel,'Year']).resample('1D',on=tlabel).max()
            print(ttmax)
Here, tlabel is ‘TIMESTAMP’, and resample(‘1D’,on=tlabel) is resampling with 1-day time-series data.
An effective plot of time-series data for several years
Reshape the one-dimensional dataset, dat(time), to the two-dimensional data, dat(year,days).
        yyyy = np.arange(date[0].year, date[date.size-1].year+1,dtype='int')
        days = np.arange(1,366,dtype='int')
        mmdd = pd.date_range(start='2001-01-01', periods=365, freq='D').strftime('%m-%d').to_numpy(dtype='str')
#        print(yyyy)
#        print(days)
#        print(mmdd)

        tmax=reshape_data(date,ttmax,var,yyyy,days,mmdd)
def reshape_data(date,series,var,yyyy,days,mmdd):
  ndat = np.empty((yyyy.size,days.size))
  ndat[:] = np.NaN
  for it in range(0, date.size):
    iy, = np.where(yyyy == date[it].year)
    id, = np.where(days == date[it].day_of_year)
    ndat[iy,id] = series[var].iloc[it]

  odat = xr.DataArray(ndat, dims=('year','day'), coords={'year': yyyy, 'day': days, 'mmdd': ('day', mmdd)})
  odat.set_index(days="mmdd")
  return(odat)
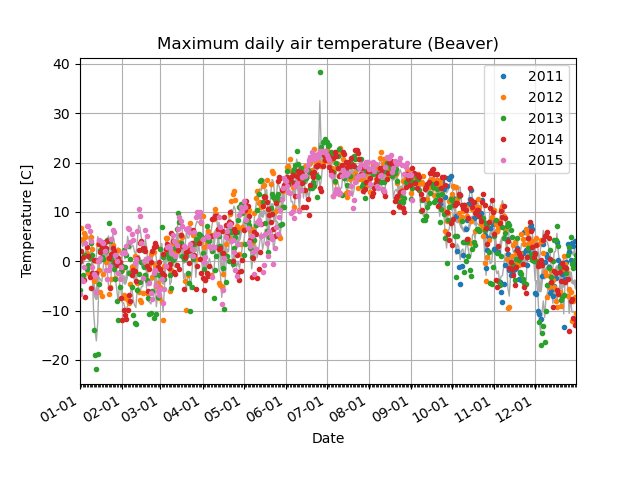
Let’s plot the data every year with different marker colors.
#        #--- calculate climatology and standard deviations for daily basis
        tmax_clm=tmax.mean(dim='year', skipna=True)
        tmax_sd=tmax.std(dim='year', skipna=True)

        # ------- Draw Figure -------

        fig, ax = plt.subplots()
        ax.plot(mmdd,tmax_clm, '-', color='darkgray', linewidth=2)
        ax.plot(mmdd,tmax_clm+tmax_sd, '-', color='darkgray', linewidth=1)
        ax.plot(mmdd,tmax_clm-tmax_sd, '-', color='darkgray', linewidth=1)

        scolor = ['C0','C1','C2','C3','C6']
        ii = 0
        for yyear in range(2011,2016):
            include = any(date.dt.year == yyear)
            if include == True:
               print('data available')
               ax.plot(mmdd,tmax.sel(year=yyear), 'o', markersize = 3, color=scolor[ii], label=yyear)
            else:
               print('no data')
            ii = ii + 1
            del include

        ax.legend()
Source file: cal_plot.tmax.py