Analysis of time average
This page shows how to calculate the time average from the data with higher time resolution.
Resample function
Resample is a convenient tool to convert data frequency and resample timeseries. For example, to resample a hour time series data, the command is the following:
Calculate hourly average
For the calculation of the average for resampling periods, we can use .mean().
from datetime import datetime, date, timedelta

var = ['TAIR1']

# Time average
datmean = dat[var].resample('1H').mean()
The ‘1H’ is the resample of data series for 1 hour, then calculate standard deviation. The examples of time/date functionality are ‘1Y’ (1 year), ‘2M’ (2 months), ‘3D’ (3 days), ‘4H’ (4 hours), ‘5m’ or ‘5T’ (5 minutes), ‘6S’ (6 seconds).
Standard deviation
The resample function can be also used to get the maximum/minimum and calculate the standard deviation for a particular time period.
For the calculation of the standard deviation, we can use .std().
from datetime import datetime, date, timedelta

var = ['TAIR1']

# Standard deviation
datstd = dat[var].resample('1H').std(ddof=0).round(5)
If ddof = 0, the standard deviation is calculated from the number of data (N).
The default setting .std() is calculated from N-1.
The command .round() shows a variable number of decimal places. For .round(5), the data indicates 12.34567.
Maximum/Minimum values
from datetime import datetime, date, timedelta

var = ['TAIR1']

# Maximum
datmax = dat[var].resample('1H').agg(['max'])
# Minimum
datmin = dat[var].resample('1H').agg(['min'])
You can also write dat[var].resample('1H').max().
Plots
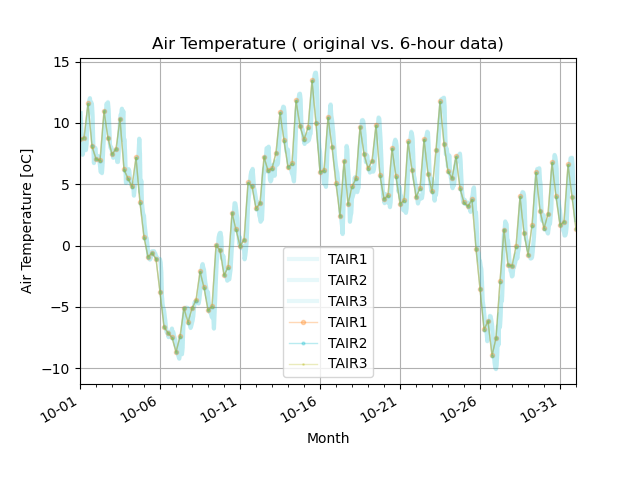
Plots comparing two time range datasets. The light-blue shaded lines are 5-minute data, and solid lines with markers are 6-hour average data. Both match, so you can confirm that the time average calculation is correct.
Sample porgram
The sample program calculates the time mean, maximum/minimum value, and standard deviation of the period (6 hours in this program) and plots the original data and the time average data.
Source file: cal_timeave.py