Seasonal Drought Forecast For the Intermountain West
01 2026
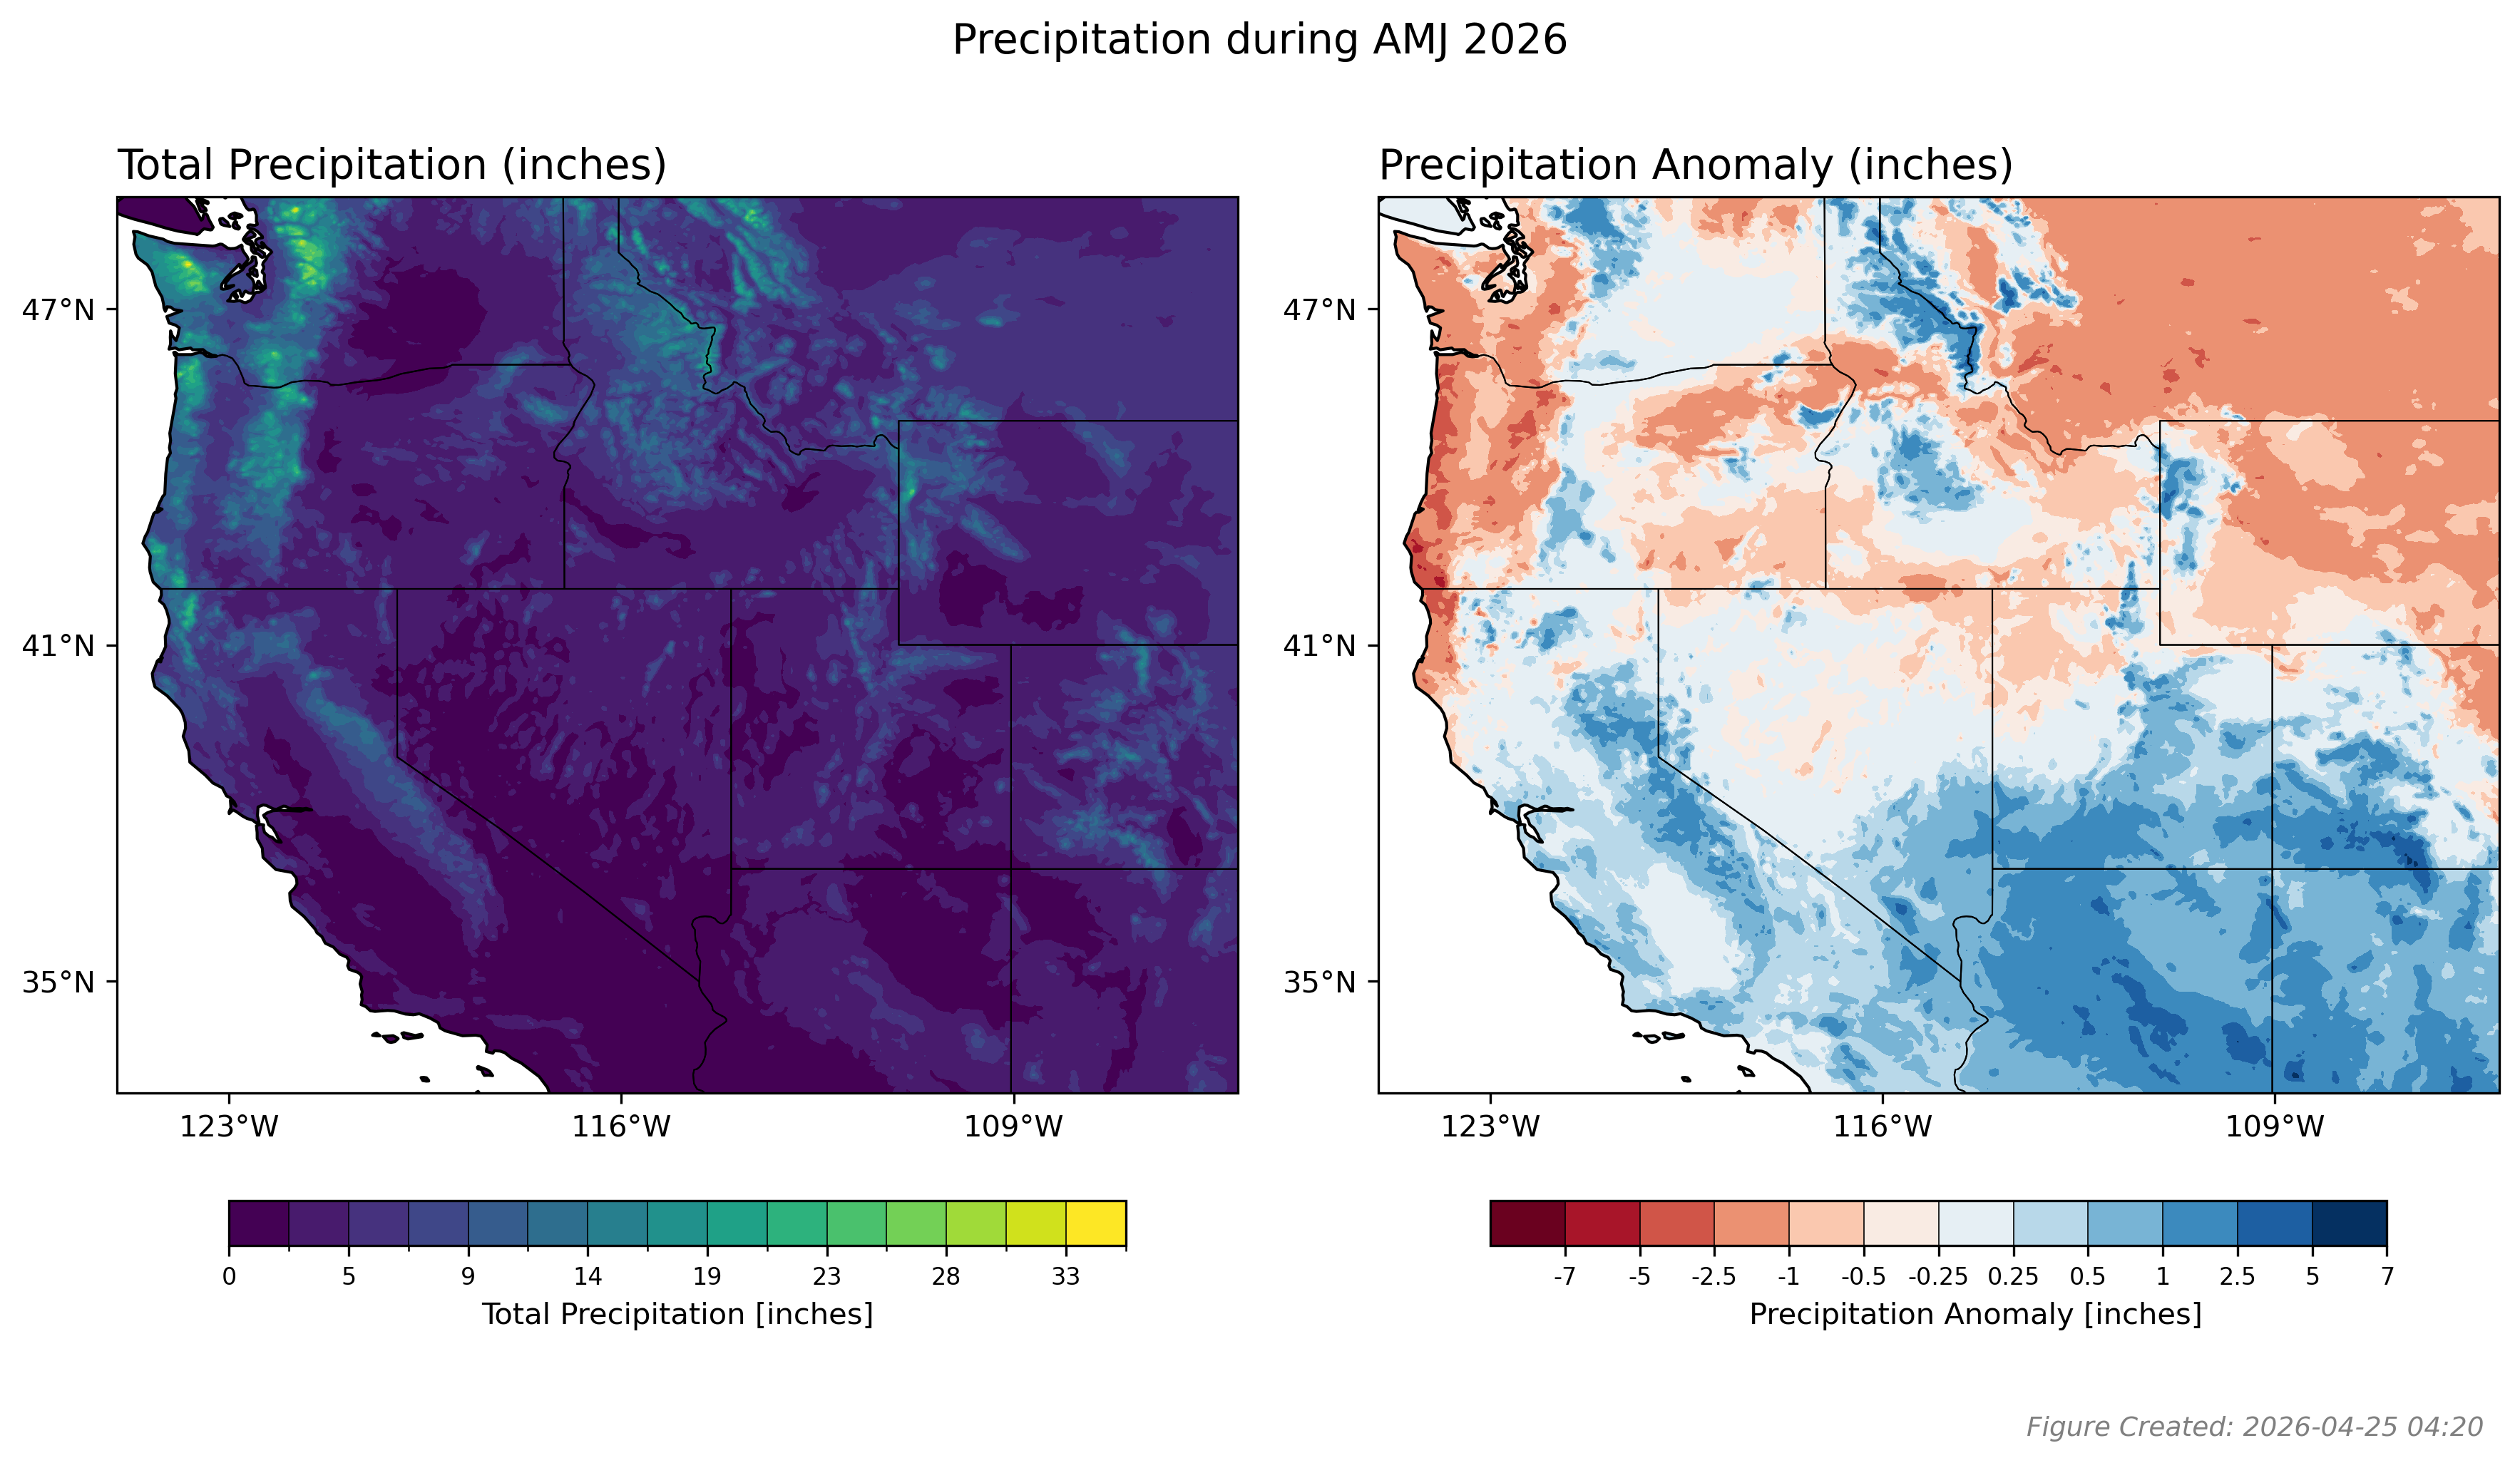
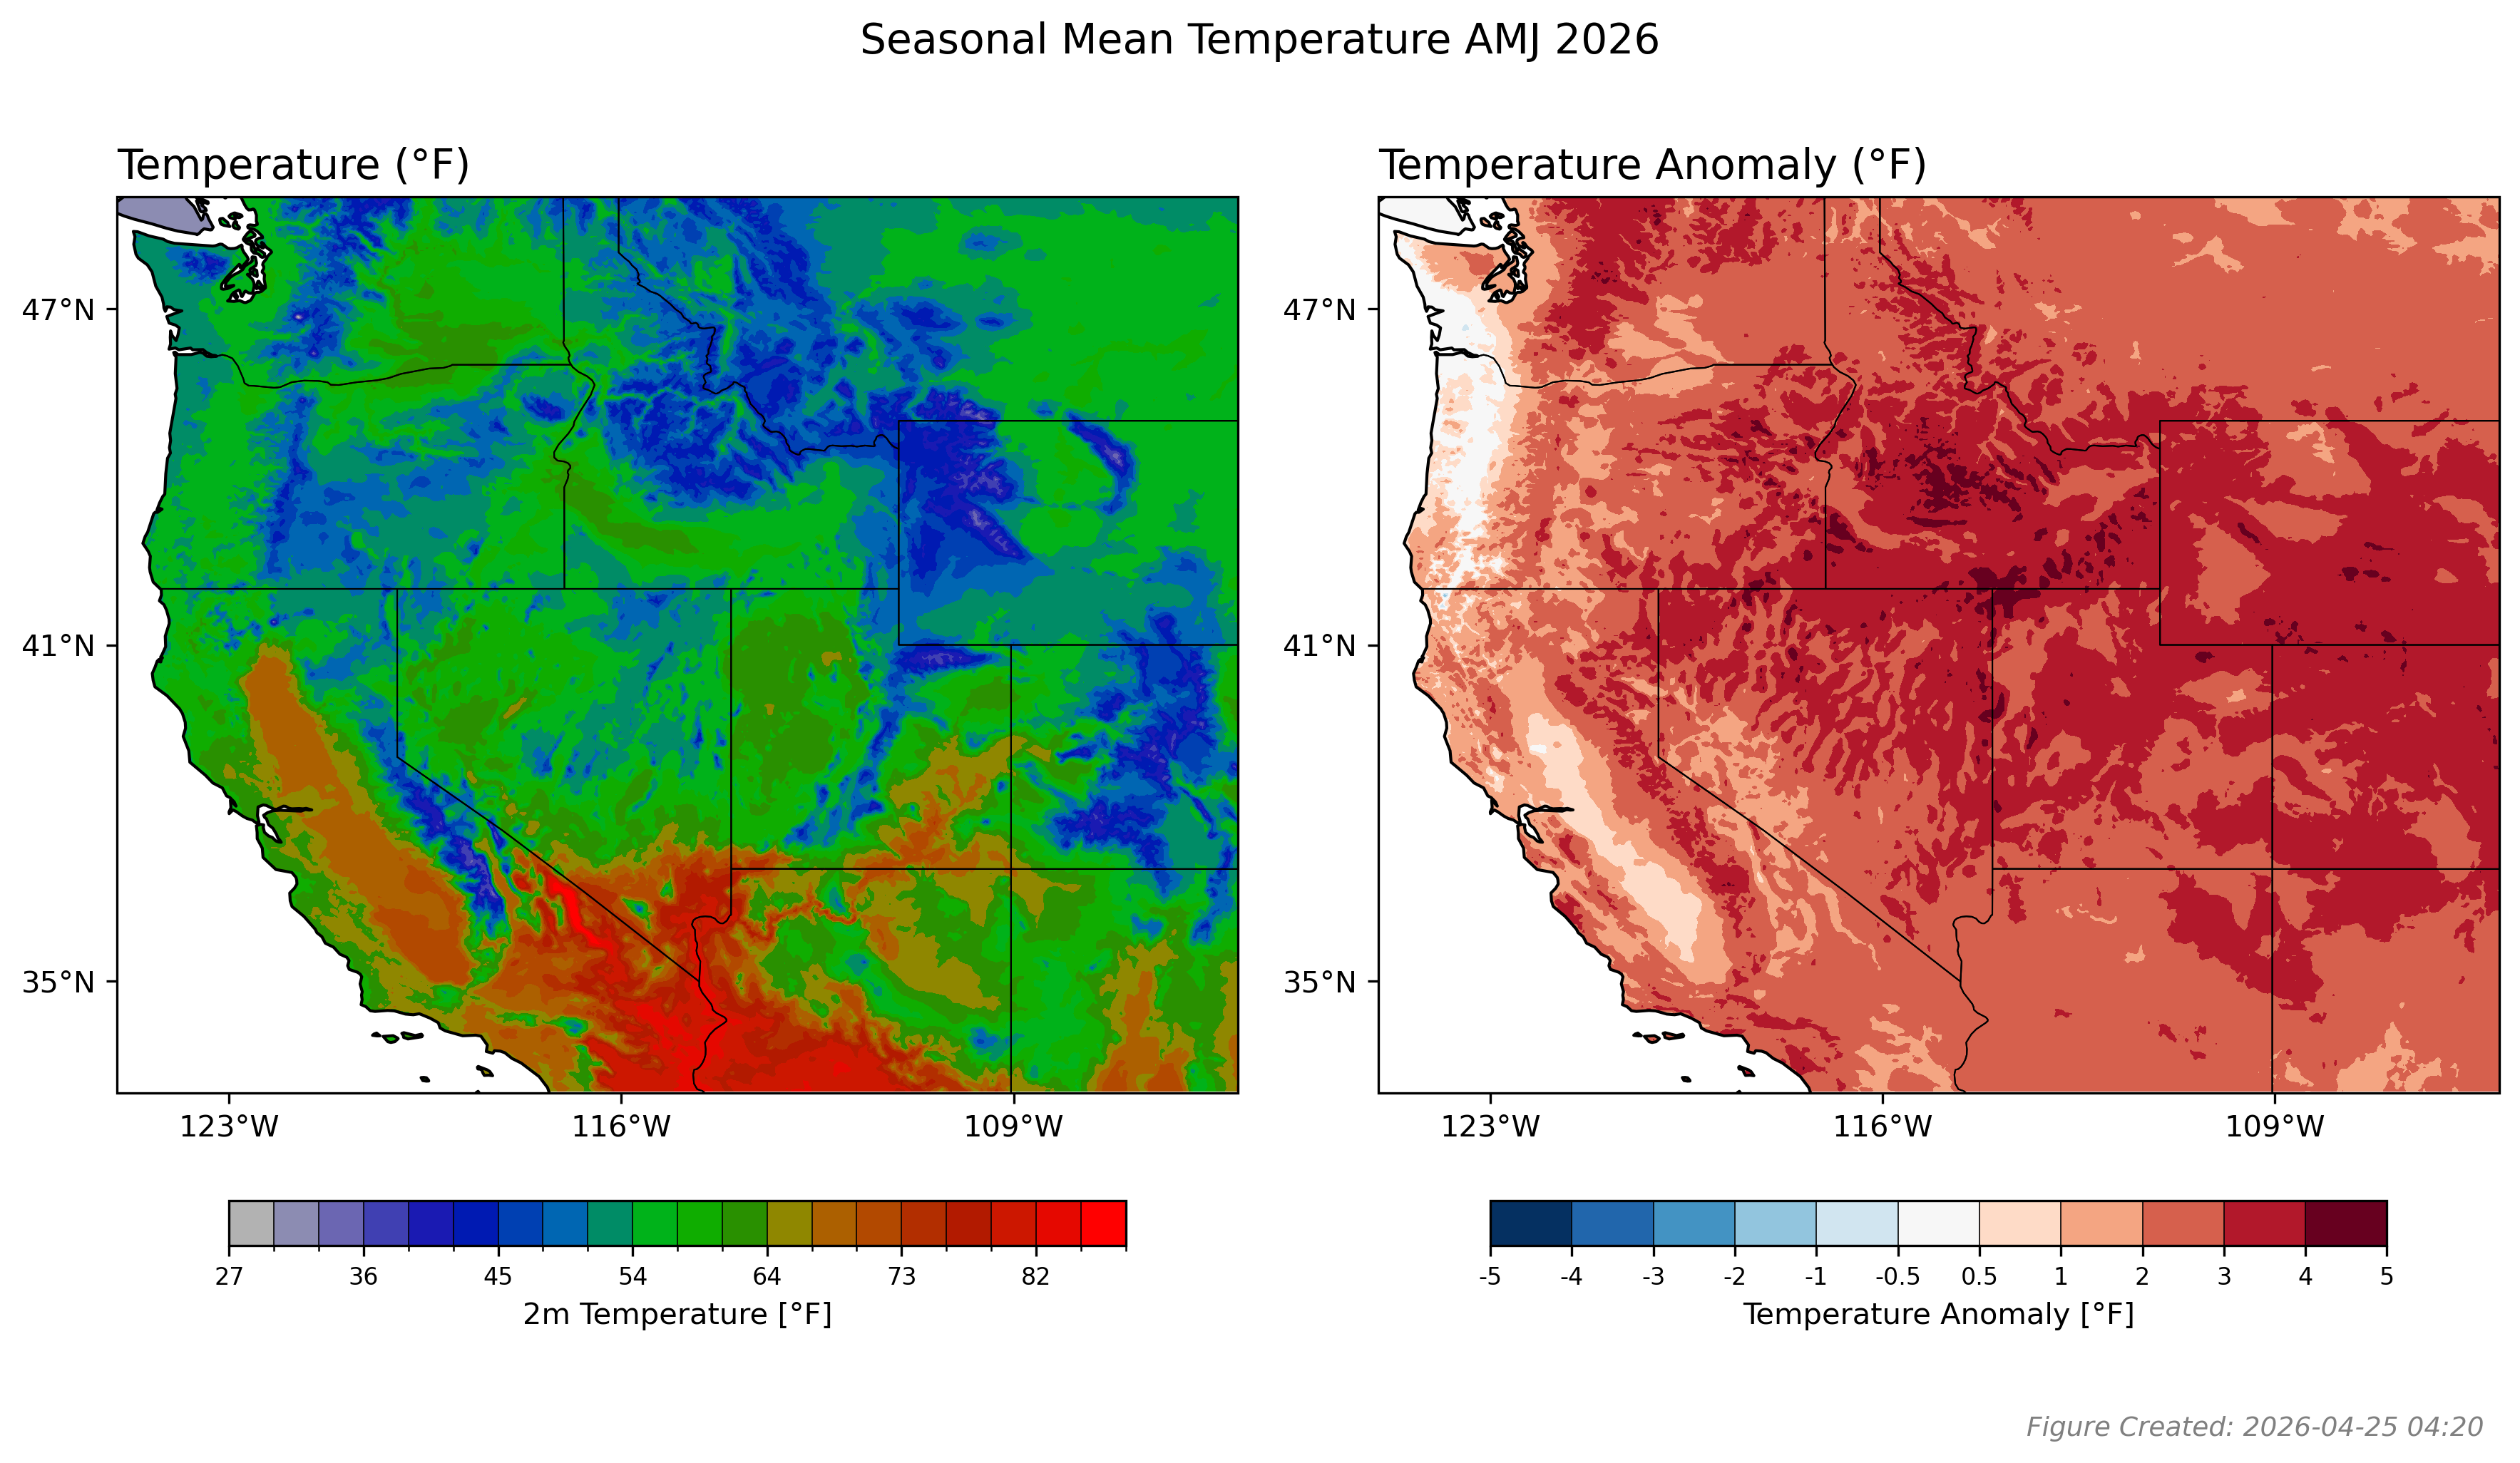
Figure 1: Downscaled NMME forecasts for total precipitation (left) and anomalous precipitation (right) from May 2026 to July 2026 (MJJ) in the Western United States.
Figure 2: Downscaled NMME forecasts for average temperature (left) and anomalous temperature (right) from May 2026 to July 2026 (MJJ) in the Western United States.
Positive anomalies indicate above-average values for temperature or precipitation, while negative anomalies indicate below-average. Both temperature and precipitation anomalies are calculated as deviations from the mean during the MJJ period from 1990 - 2020.
The NMME forecasts (Kirtman et al., 2014) were trained from 1982-2012 and then statistically downscaled using the analog method (Gutmann et al., 2022), with 4-kilometer PRISM data as the observational record (Daly et al., 2008). The analog method identifies historical patterns that closely match the forecast for a specific month and uses these patterns to refine the forecast based on the resolution of the observational dataset.
References
-
Gutmann, Ethan D., et al. En-GARD: A Statistical Downscaling Framework to Produce and Test Large Ensembles of Climate Projections. Journal of Hydrometeorology, 23.10 (2022): 1545-1561. doi:10.1175/JHM-D-21-0142.1.
-
Kirtman, Ben P., et al. The North American multimodel ensemble: phase-1 seasonal-to-interannual prediction; phase-2 toward developing intraseasonal prediction. Bulletin of the American Meteorological Society, 95.4 (2014): 585-601. doi:10.1175/BAMS-D-12-00050.1.
-
Daly, Christopher., et al. Physiographically sensitive mapping of climatological temperature and precipitation across the conterminous United States. International Journal of Climatology. 28.15 (2008): 2031-2064. doi:10.1002/joc.1688
-
Vernon, B., Zhang, W., and Chikamoto, Y. Statistical downscaling as a method for improving seasonal forecasting in the Western United States. (In preparation). 2024. Vernon, B., Zhang, W., and Chikamoto, Y. Improving Seasonal Precipitation Forecasts in the Western United States through Statistical Downscaling. (Environmental Research Letters). 2025.


This utility has been developed in partnership with the Bureau of Reclamation and the Utah Agricultural Experiment Station