Welcome to WeClimate-py!
What is Weather/Climate data analysis?
This page introduces the basic Python programming for reading, creating, and drawing meteorological station data.
Get Started - Initial Setup
Lesson 1 - Data IO
Lesson 2 - Data management
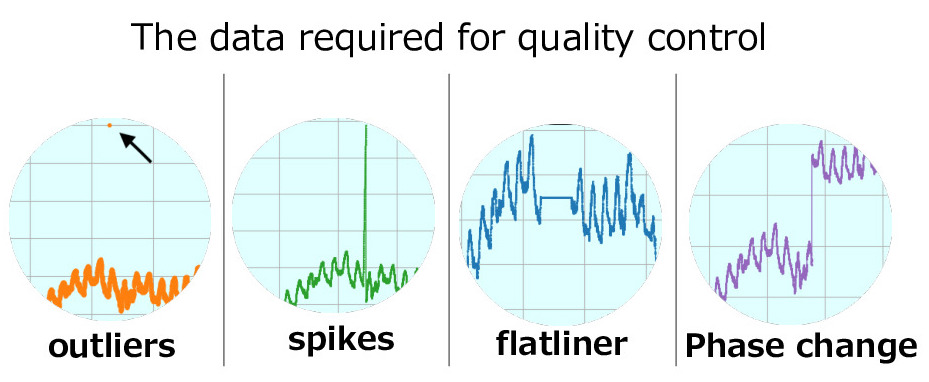
Lesson 3 - QC/QA
Lesson 4 - Analysis
Lesson 5 - Visualization
Garelly
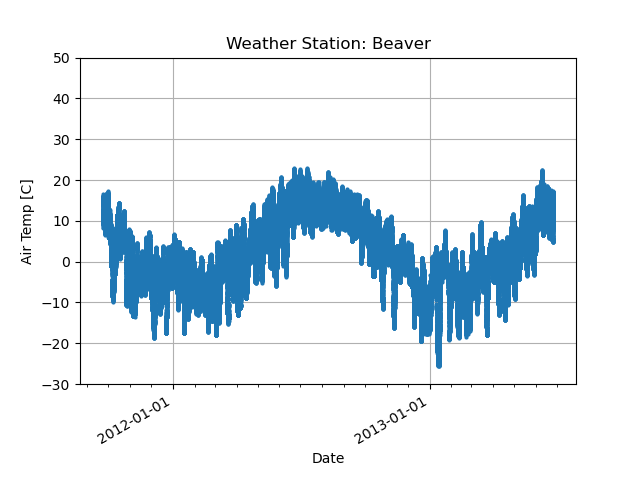
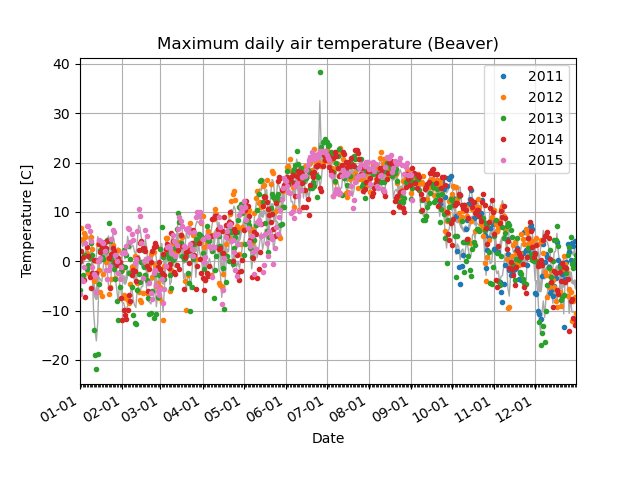
This gallery is a sample of some visualizations presented in the sample programs with Python Matplotlib on this page.
Time series (blue time-series plot, daily maximum plots for 5 years)
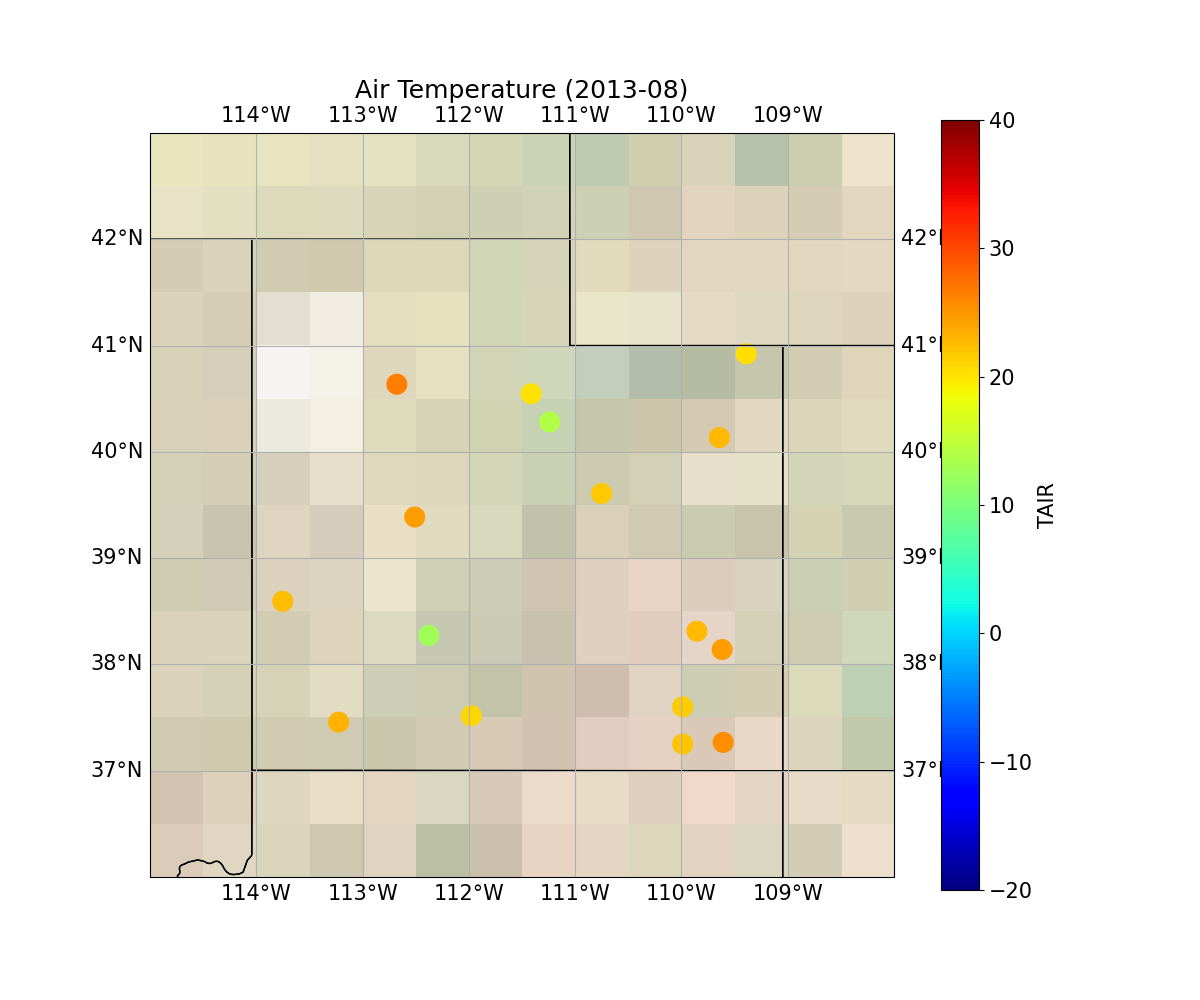
Map Projection with Cartopy (left) and PyGMT (right) package.